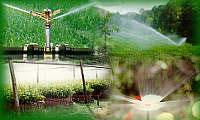
 As of 2012, India has the world’s highest percentage of arable land to the total geographical area, in the world and the world’s highest land area is irrigated.
Arable/ Irrigated land sizes, 2012
Source – UN Food and Agriculture Organization
| Country | Irrigated land (sq km) | Cultivated land (sq km) | Arable land (million hectares) | Permanent crops (sq km) |
| India | 558,080 | 1,535,063 | 1,574 | 83,249 |
| USA | 223,850 | 1,669,302 | 1,602 | 19,240 |
| China | 545,960 | 1,504,350 | 1,116 | 118,445 |
| Russia | 46,000 | 1,192,300 | 1,215 | 18,016 |
| Brazil | 29,200 | 661,299 | 719 | 75,263 |
2011 figures from UN’s Food and Agriculture Organization, Wikipedia, Indian Ministry of Agriculture state that:
- India ranks second worldwide in farm output accounting for 52% of the labour force and 15% of GDP in 2011.
- It is the second largest producer of rice, wheat, sugarcane, cotton and groundnuts
- India has the third largest fishing industry in the world.
- India is the largest producer in the world of milk, jute and pulses.
- India has the world’s second largest cattle population with 175 million animals in 2008 (such as sheep, goats, buffalo, cow, pigs etc), almost 25% of the world total.
- India has the second largest fruit and vegetable producer, accounting for 10.9% and 8.6% of the world fruit and vegetable production respectively.
- From being an importer of food after independence; India has now become an exporter of food. India is amongst the five largest exporters of rice in the world and top ten exporter of wheat.
- India is also the second largest producer and the largest consumer of silk in the world, producing 77,000 million tons in 2005.
- India has the largest area in the world under pulse crops
- India is the first in the world to evolve a cotton hybrid.
Total food grain production has increased from 50.82 million tonnes in 1951 to 176 million tonnes in 1990 to 208 million tonnes in 2006. Crop Yield of total foodgrains has increased from 1552 (kg per hectare) in 1997-98 to 1703 (kg per hectare) in 2004-05.
World Production of Wheat, 2013
Source – UN Food and Agriculture Organization
(in million metric tons)
| Country | Wheat | |
| 1. 2. 3. 4. 5. 6. 7. 8. 9. 10. |
China India USA Russia France Canada Germany Pakistan Australia Ukraine |
121.7 93.5 60 52.1 38.6 37.5 25 24.2 22.9 22.8 |
 World Production of Rice, 2012
Source – UN Food and Agriculture Organization
(in million metric tons)
| Country | Rice | |
| 1. 2. 3. 4. 5. 6. 7. 8. 9. 10. |
China India Indonesia Vietnam Thailand Bangladesh Myanmar Philippines Brazil Japan |
204.3 152.6 69 43.7 37.8 33.9 33 18 11.5 10.7 |
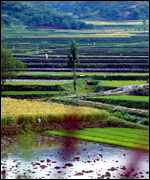
The farmers and their families use most of their crops. Half of all Indian farms are less than 2.5 acres (1 hectare) in area. Only 4 percent cover more than 25 acres (10 hectares). About two-thirds of the farmers in India own their own land. Most of their farms become smaller and smaller with each generation because of inheritance customs.
World’s leading producers of other agricultural products, 2001
Source – UN Food and Agriculture Organization
(in millions of metric tons)
| Production indicator | India’s rank in the world |
| Tea production Groundnuts (shell) Cashews Pulses Sesame seeds Peanuts Raw sugar Mangoes Millet Betel nuts Cardomom Ginger Pepper Turmeric Rapeseed Sugarcane Jute Onions Cauliflowers Milk (cow/ buffalo) Coconuts Cotton (seed) Cotton (lint) Eggs (Hens) Corn |
First First First First First First First First First First First First First First Second Second Second Second Second Second Third Third Fourth Fifth Seventh |
- India grows more than half of the world’s mangoes and leads all countries in the production of tea (80% of all beverage consumption in India is tea; 10% coffee and 10% others like soft drinks). India is also a major producer of apples, bananas, coffee, eggplants, oranges, potatoes, tobacco and wheat.
- India is the fifth leading fertilizer producer in the world after USA, Canada, China and France. India is the fourth largest consumer of fertilizer in the world, after the USA, Russia and China.
- Tests in 2000, by a team of experts have confirmed that Naga Jolokia or capsicum frutescens, a specialty from Assam in the northeast, is now the world’s hottest chili, surpassing the tongue-burning ability of the Red Savina Habanero, a Mexican chili that had been known as the world’s hottest. Naga Jolokia measured 855 Scoville units, compared to 577 for the Habanero.
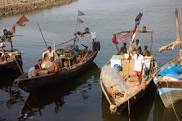 Commercial catch of fish (capture and aquaculture total), 2012
Source – UN Food and Agriculture Organization
(in millions of metric tons)
| Country | 2012 | |
| 1. 2. 3. 4. 5. 6. 7. 8. 9. 10. |
China India Indonesia Vietnam USA Peru Russia Myanmar Japan Chile |
57.28 9.07 8.88 5.71 5.55 4.92 4.48 4.47 4.28 3.64 |
Note: India’s numbers were 0.8 million metric tons in 1950 and 5.25 in 1998