 Once recognizing the amazing wealth of Indians, the Afghan invader Mohammad Ghauri said: “I have heard that there is a country of people where the mountains are made of gold, the cultivable lands are made makhmal and the children of this land play the toy balls made of diamond.”
As the painstaking statistical work of the Cambridge historian Angus Maddison has shown, India was the richest country in the world till 1,700 century AD. India’s share of world income collapsed from 22.6% in 1700, to as low as 3.8% in 1952. Indeed, at the beginning of the 20th century, “the brightest jewel in the British Crown” was left the poorest country in the world. However today, India is the second fastest growing economy in the world.
Countries with highest Gross Domestic Product in the world (2014-15):
Source: International Monetary Fund (USD trillion)
| Country | GDP (based on PPP) | GDP (official exchange rates) | |
| 1 2 3 4 5 6 7 8 9 10 11 12 13 14 15 |
China USA India Japan Germany Russia Brazil Indonesia France United Kingdom Mexico Italy South Korea Saudi Arabia Canada |
$17.632 $17.416 $7.277 $4.788 $3.621 $3.559 $3.073 $2.674 $2.587 $2.435 $2.144 $2.066 $1.79 $1.652 $1.579 |
$9.24 $16.08 $1.9 $4.9 $3.7 $2.1 $2.3 $0.87 $2.8 $2.7 $1.3 $2.1 $1.12 $0.749 $1.8 |
Notes:
– Purchasing Power Parity (PPP) involves the use of international dollar weights applied to quantities of goods and services produced in a given economy
India sector-wise contribution (GDP and labour)
Source: Indian government sources
| Sector | Contribution to GDP (2010-11) | India’s 500 million labour by occupation (2011) |
| Agriculture Industry Services |
15% 28% 57% |
52% 14% 34% |
India’s GDP and per capita GDP (Rupee terms)
Source: Reserve Bank of India
| Year | GDP (at current prices) Rs cr. | Per capita annual income Rs. |
| 2011-12 2010-11 2009-10 2008-09 2007-08 2006-07 2005-06 2004-05 2003-04 2002-03 |
– 71,57,412 62,31,200 53,03,567 46,93,602 – 34,195,278 – – 22,36,128 |
60,972 53,331 – – 29,786 27,784 25,696 23,890 22,413 20,996 |
As per PPP, India’s $3,700 per capita income of 2011 (est.) compared with U.S. $48,100, Germany $37,900, Japan $34,300 and China $8,400. As per a 2009 government estimate, 37% of India’s population lived below the poverty line.
Major Finance indicators, March 2011
Source: Ministry of Finance, India (In Rs lakh crores)
| Indicators (Centre + state combined) |
1990-91 | 2000-01 | 2010-011 (est.) |
| Total Expenditure Total Revenue (tax/ non-tax) Deficit |
1.55 0.98 0.57 |
5.52 3.47 2.05 |
19.74 13.7 6.04 |
Worldwide Foreign Exchange Reserves
Source – IMF (March 2015)
| Country | Reserves (including Gold and SDR) (in US$ billions) |
| China Japan Saudi Arabia Switzerland Taiwan Brazil South Korea Russia India Hong Kong Singapore Mexico Germany Algeria Thailand France Italy UK Turkey USA Libya |
3,899 1,261 734 586 421 363 362 355 343 333 251 198 194 193 155 179 147 139 131 123 121 |
Worldwide Gold Reserves
Source – World Gold Council (March 2015)
| Country | Gold reserves (in thousand tons) |
| USA Germany Italy France Russia China Switzerland Japan Netherlands India Turkey Taiwan Portugal Venezuela Saudi Arabia UK Lebanon Spain |
8.134 3.384 2.452 2.435 1.208 1.054 1.040 0.765 0.613 0.558 0.530 0.423 0.383 0.368 0.323 0.310 0.287 0.282 |
Note: This list does not include gold reserves of IMF, EU central bank, Bank for International settlements etc.
Non-Resident Indian (NRI) inflows, 2014
Source: World Bank Global Economic Prospects report
India leads the world in remittances by over 20 million overseas workers. China is number two, with $64 billion remittances in 2014.
| March year-end | Total NRI deposits outstanding (US $ Billion) |
| 1991 1998 2000 2003 2004 2006 2010 2014 |
13.99 20.37 21.68 28.27 33.27 35.13 49.88 70.38 |
Indian government balance sheet (Gross public debt was 62% of GDP)
Source: Ministry of Finance
| Liability | 2010 (USD b) | 2000 (USD b) |
| Public Debt Internal Debt |
523 493 |
178 165 |
 India’s external debt
Source: Ministry of Finance
(includes long-term debt like IMF loans, Commercial borrowings, export credit, NRI deposits, Rupee debt AND short term debt)
| Year (as of) | External debt (US $ billion) |
| Dec 2011 Mar 2011 Mar 2010 Mar 2009 2008 2007 2006 2004 1999 1991 1990 1980 |
335 306 261 225 224 172 139 111.7 96.89 83.8 70.2 20.6 |
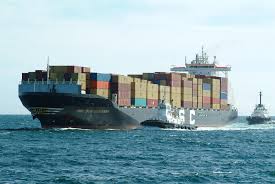
 India’s share in the global trade, has increased from 0.4% in 1980-95 to 1.1% in 2004 to 1.5% in 2006-07 and about 2% in 2014. Foreign trade, as a percentage of GDP (in rupee terms) was over 45% in 2010, up from 14.1% in 1990-91.
Total foreign trade by India:
Source: Indian Ministry of Commerce and Industry (Rs lakh Cr.)
| Year | Exports | Imports |
| 1997-98 2002-03 2005-06 2007-08 2008-09 2009-10 2010-11 |
1.30 2.50 4.55 6.56 8.41 8.46 11.43 |
1.55 2.97 6.31 10.12 13.75 13.64 16.84 |
World’s top exporters (2011)
Source: World Trade Organization
| Country | Export value (US$ billion) |
| European Union China USA Germany Japan France Netherlands South Korea Italy Russia UK Canada Hong Kong Singapore Saudi Arabia Mexico Belgium Spain Taiwan Switzerland India (rank 19) Australia |
2,131 1,898 1,511 1,408 801 578 577 557 522 499 495 451 428 409 351 336 332 331 325 308 304 266 |
 India’s export growth is the second fastest in the world after China’s. India’s services contributed about 35% of the total exports as of 2010-11. India’s chief exports include computer software, agricultural products (cashews, coffee, tea, pulses, spices and tobacco), cotton yarn and clothing (ready-made garments and silk), gems and jewellery, cut diamonds, handicrafts, iron ore, mica, jute products, leather goods, shrimp. The country also exports industrial goods, such as appliances, electronic products, transport equipment, light machinery as well as chemical and engineering products. India imports rough diamonds, cuts them, and exports the finished gems. India’s export partners are US 12.6%, UAE 12.2%, China 8.1%, Hong Kong 4.1% (2010)
World’s top importers (2011)
Source: World Trade Organization
| Country | Import value (US$ billion) |
| European Union USA China Germany Japan France UK Italy South Korea Netherlands Hong Kong India |
2,344 2,314 1,744 1,339 795 686 655 541 526 514 493 489 |
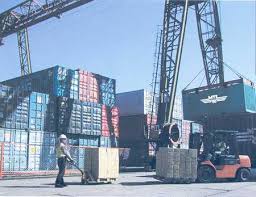 Capital goods and fuel, each account for more than a quarter of Indian imports. Other imports of India include edible oils, fertilizer, food grains, iron and steel, industrial machinery, professional instruments and transportation equipment. Chemicals, precious and semi-precious stones and non-ferrous metals are the other major imports. India’s main import partners included China 12.4%, UAE 6.5%, Saudi Arabia 5.8%, US 5.7%, Australia 4.5% (2010).
Foreign Exchange Rates (per US $)
Source – International Monetary Fund
| Year | Indian Rupee (annual averages) |
| 1950 1960 1970 1975 1980 1985 1990 1991 1992 1993 1994 1995 1996 1997 1998 2000 June 2002 Jan 2004 Aug 2005 Jan 2006 Apr 2007 Apr 2010 Apr 2011 May 2012 June 2012 July 2013 April 2015 |
4.79 4.77 7.58 8.41 7.89 12.37 17.51 22.74 25.92 30.49 31.37 32.43 35.43 36.31 41.26 45.0 49.04 45.6 43.45 44.04 41.01 45 – 53.45 57 60 62 |
The Indian rupee is significantly, albeit not fully, convertible for current account balances. By and large, the Indian exchange control regime is flexible to allow the market to play an important role in the determination of the exchange rate.
Foreign Direct Investment
According to UNCTAD’s report, India’s is ranked 9th most attractive investment destination in the world, in terms of FDI (Foreign Direct Investment). FDI as a percentage of GDP has increased from 0.9% in 2005 to 2.8% in 2008 (higher than China’s)
Foreign funds inflow, 2011
Source: Reserve Bank of India
| Foreign Direct Investment (excludes portfolio investments) | Foreign Investment Inflows (Includes direct & portfolio investments) | |
| 1990-1998 1998-2003 2010-2011 |
US$ 10.6 billion US$ 13.43 billion US $30 billion |
US$ 26.53 billion US$ 28.54 billion US $ 100 billion |