 About 30% of power generated in India is by private companies. India’s Ministry of Power claims that industrial demand accounted for 35% of electrical power requirement, domestic household use accounted for 28%, agriculture 21%, commercial 9%, public lighting and other miscellaneous applications accounted for the rest.
World’s producers & consumers of electricity, 2013-14
Source: International Energy Agency
| Consumption GW-hr |
Watts consumed per person | Production GW-hr |
|
| China USA India Japan Russia Germany Canada France Brazil S. Korea |
5463,800 4686,400 1111,722 859,700 1016,500 582,500 499,900 462,900 455,800 455,100 |
458 1683 90 774 808 861 1871 804 268 1038 |
5649,500 4260,400 1102,900 1088,100 1069,300 633,600 626,800 568,430 557,400 534,700 |
India’s power installed capacity breakup
Source: Indian Ministry of Power and Ministry of New and Renewable Energy
| As of 31 March 2013 | Total installed capacity (223,344 MW) |
| Thermal (coal, gas, diesel) | 151,530 |
| Hydro | 39,491 |
| Nuclear | 4,780 |
| Renewable (total) | 27,542 |
| Renewable (wind) *2012 | 14,989 |
| Renewable (small hydro) *2012 | 3,154 |
| Renewable (Biomass/ sugar bagasse) *2012 | 3,332 |
| Renewal (Waste to energy) *2012 | 150 |
| Renewal (Solar) *2012 | 119 |
Notes:
- Rural electrification in India was up from 43.5% in 1991 to over 86% in 2011, according to Census of India. While 80% of Indian villages have at least an electricity line, 56% of rural households have no electricity.
- Transmission and distribution losses amount to around 32% in 2010 (Source: International Energy Agency, France). Another source OECD, says transmission losses are 24% and losses due to theft was another 15%, compared with 3% total in China. Stolen electricity amounts to 1.5% of GDP.
- Installed capacity was 66 GW in 1991 and 100 GW in 2001
- Per capita consumption has grown from 15.6 kWH in 1950 to 314 kWH in the 1990’s to 700 kWH in 2012.
![]()
Source: Central Statistics Office of India
| Coal production (million tonnes) |
Lignite production (million tonnes) | |
| 1970-71 1980-81 1990-91 2000-01 2007-08 2008-09 2009-10 2010-11 2012-13 |
72.95 113.91 214.06 313.7 457.08 492.76 532.06 532.69 557.45 |
3.39 5.11 14.07 22.95 33.98 32.42 34.07 37.73 – |
Notes:
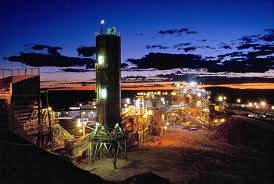
- Coal mining in India dates back to the 18th century.
- India is the third largest producer of coal in the world, after USA and China.
- As on March 2011, the estimated reserves of coal was around 286 billion tones (fourth largest in the world) and the estimated reserve of lignite was 41 billion tonnes, of which 80% was in the southern State of Tamil Nadu.
- 70% of power generation in India is coal-based.
- As on March 2011, a total of 52 washeries, both PSUs and Private, were operating in the country. The total installed washing capacity was 131 million tonnes (MT) per annum considering, both Coking (29.69 MTY) and Non-Coking Coal (101.55 MTY).
- Non-coking coal reserves aggregate 85 per cent, while coking coal reserves are the remaining 15 per cent.
- Indian coal has high ash content (15-45%) and low calorific value.
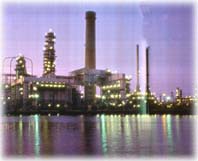
The origin of the oil industry in India can be traced back to the last part of the 19th century when petroleum was discovered in Digboi in north-east India. Digboi’s Oil refinery is the oldest working refinery in the world.
| 2013 | Crude oil consumption (million barrels per day) |
| USA China Japan India Russia Saudi Arabia Brazil Germany |
19 10.3 4.5 3.6 3.5 3 3 2.4 |
Notes:
- The estimated reserves of crude oil in India as on March 2011 stood at 757 million tonnes (MT) – twentieth largest in the world.
- India is self-sufficient in crude oil refining. As on March 2011 there were a total of 20 refineries in the country, 17 in the Public Sector and 3 in the private sector.
- World’s highest retail Petrol pump outlet is at 12, 001 ft. above sea level, at Leh
India’s crude oil, petroleum products and natural gas production
Source: Central Statistics Office of India (million tonnes)
| Crude oil refining | Crude oil production | Petroleum products | Natural gas (billion cu m) |
|
| 1970-71 1980-81 1990-91 2000-01 2007-08 2008-09 2009-10 2010-11 |
34 – – 116 – – 193 206.15 |
6.82 10.51 33.02 32.43 34.12 33.51 33.69 37.71 |
18 24 49 96 145 151 180 190 |
0.65 1.52 12.77 27.86 31.48 31.75 46.51 51.25 |
Of all types of petroleum products, high speed diesel oil accounted for the maximum share (41%), followed by Motor Gasoline (13.73%), Fuel Oil (10.78%), Naphtha (9.2%). Kerosene (4%) and Aviation Turbine Fuel (5%).
India’s Natural Gas production
- The estimated reserves of natural gas in India as on March 2011 stood at 1241 billion cubic meters (BCM). According to Oil and Gas Journal, India had approximately 38 trillion cubic feet (Tcf) of proven natural gas reserves as of January 2011, world’s 26th largest.
- United States Energy Information Administration estimates that India produced approximately 1.8 Tcf of natural gas in 2010, while consuming roughly 2.3 Tcf of natural gas.
- According to a 2011 Oil and Gas Journal report, India is estimated to have between 600 to 2000 Tcf of shale gas resources (one of the world’s largest).
- Bombay High has estimated reserves of 6.1 billion barrels.
Source: Central Electricity Authority of India
| Year-ending March | Mega watts |
| 1971 1981 1991 2001 2011 2014 |
6,383 11,791 18,753 25,153 37,567 39,788 |
Notes:
- Includes small hydro power plants’ 3,000+ MW.
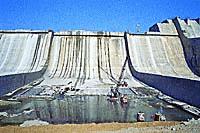
- The Grand Anicut, Kallanai, located on Cauvery River in Tamil Nadu, is the oldest dam in the world.
- As of July 2010, India has already built 4,300 dams.
- India is 6th largest hydro-electricity producer in the world
- India’s viable hydro potential is about 94,000 MW including small, mini, and micro hydel schemes.
World’s Highest Dams, 2010
Source: US’ International Commission on Large Dams
| Name | Height (m) above lowest formation |
| Nurek, Tajikistan Xiaowan, China Dixence, Swiss Inguri, Georgia Vajont, Italy Torres, Mexico Tehri, India Mauvoisin, Swiss Laxiwa, China Lleraso, Colombia Dernier, Turkey Mica, Canada Shushensk, Russia Ertan, China La Esmeralda, Colombia Bhakra, India |
300 292 285 272 262 261 261 250 250 250 249 243 242 240 237 236 |
Note: Tajikstan (Rogun dam) and China is building several dams, which would have heights of 240-310 m.

Source: World Wind Energy Association
| Nation | 2006 | 2014 |
| China | 2,599 | 114,763 |
| United States | 11,603 | 65,879 |
| Germany | 20,622 | 39,165 |
| Spain | 11,630 | 22,987 |
| India | 6,270 | 22,465 |
| UK | 1,963 | 12,440 |
| Canada | 1,460 | 9,694 |
| France | 1,589 | 9,285 |
| Italy | 2,123 | 8,663 |
| Brazil | 237 | 5,939 |
India is 12th highest solar power generator in the world at 2.3 GW. Target is 10 GW by 2017.

Source: International Atomic Energy Agency/ World Nuclear Association
| Country | Nuclear Electricity capacity (mega watt) |
| USA France Japan Russia South Korea China Canada Ukraine Germany Sweden UK Spain Belgium India Taiwan |
99,081 63,130 42,388 23,643 20,721 17,978 13,538 13,107 12,068 9,474 9,243 7,121 5,927 5,308 5,032 |